Oceanography Modeling
Dynamically Downscaled Regional Projections of
Ocean Acidification in the Main Hawaiian Islands
Lucia Hošeková, Tobias Friedrich, Brian Powell, Christopher L. Sabine, Guangpeng Liu, Jacob Gunnarson, Malte Stuecker
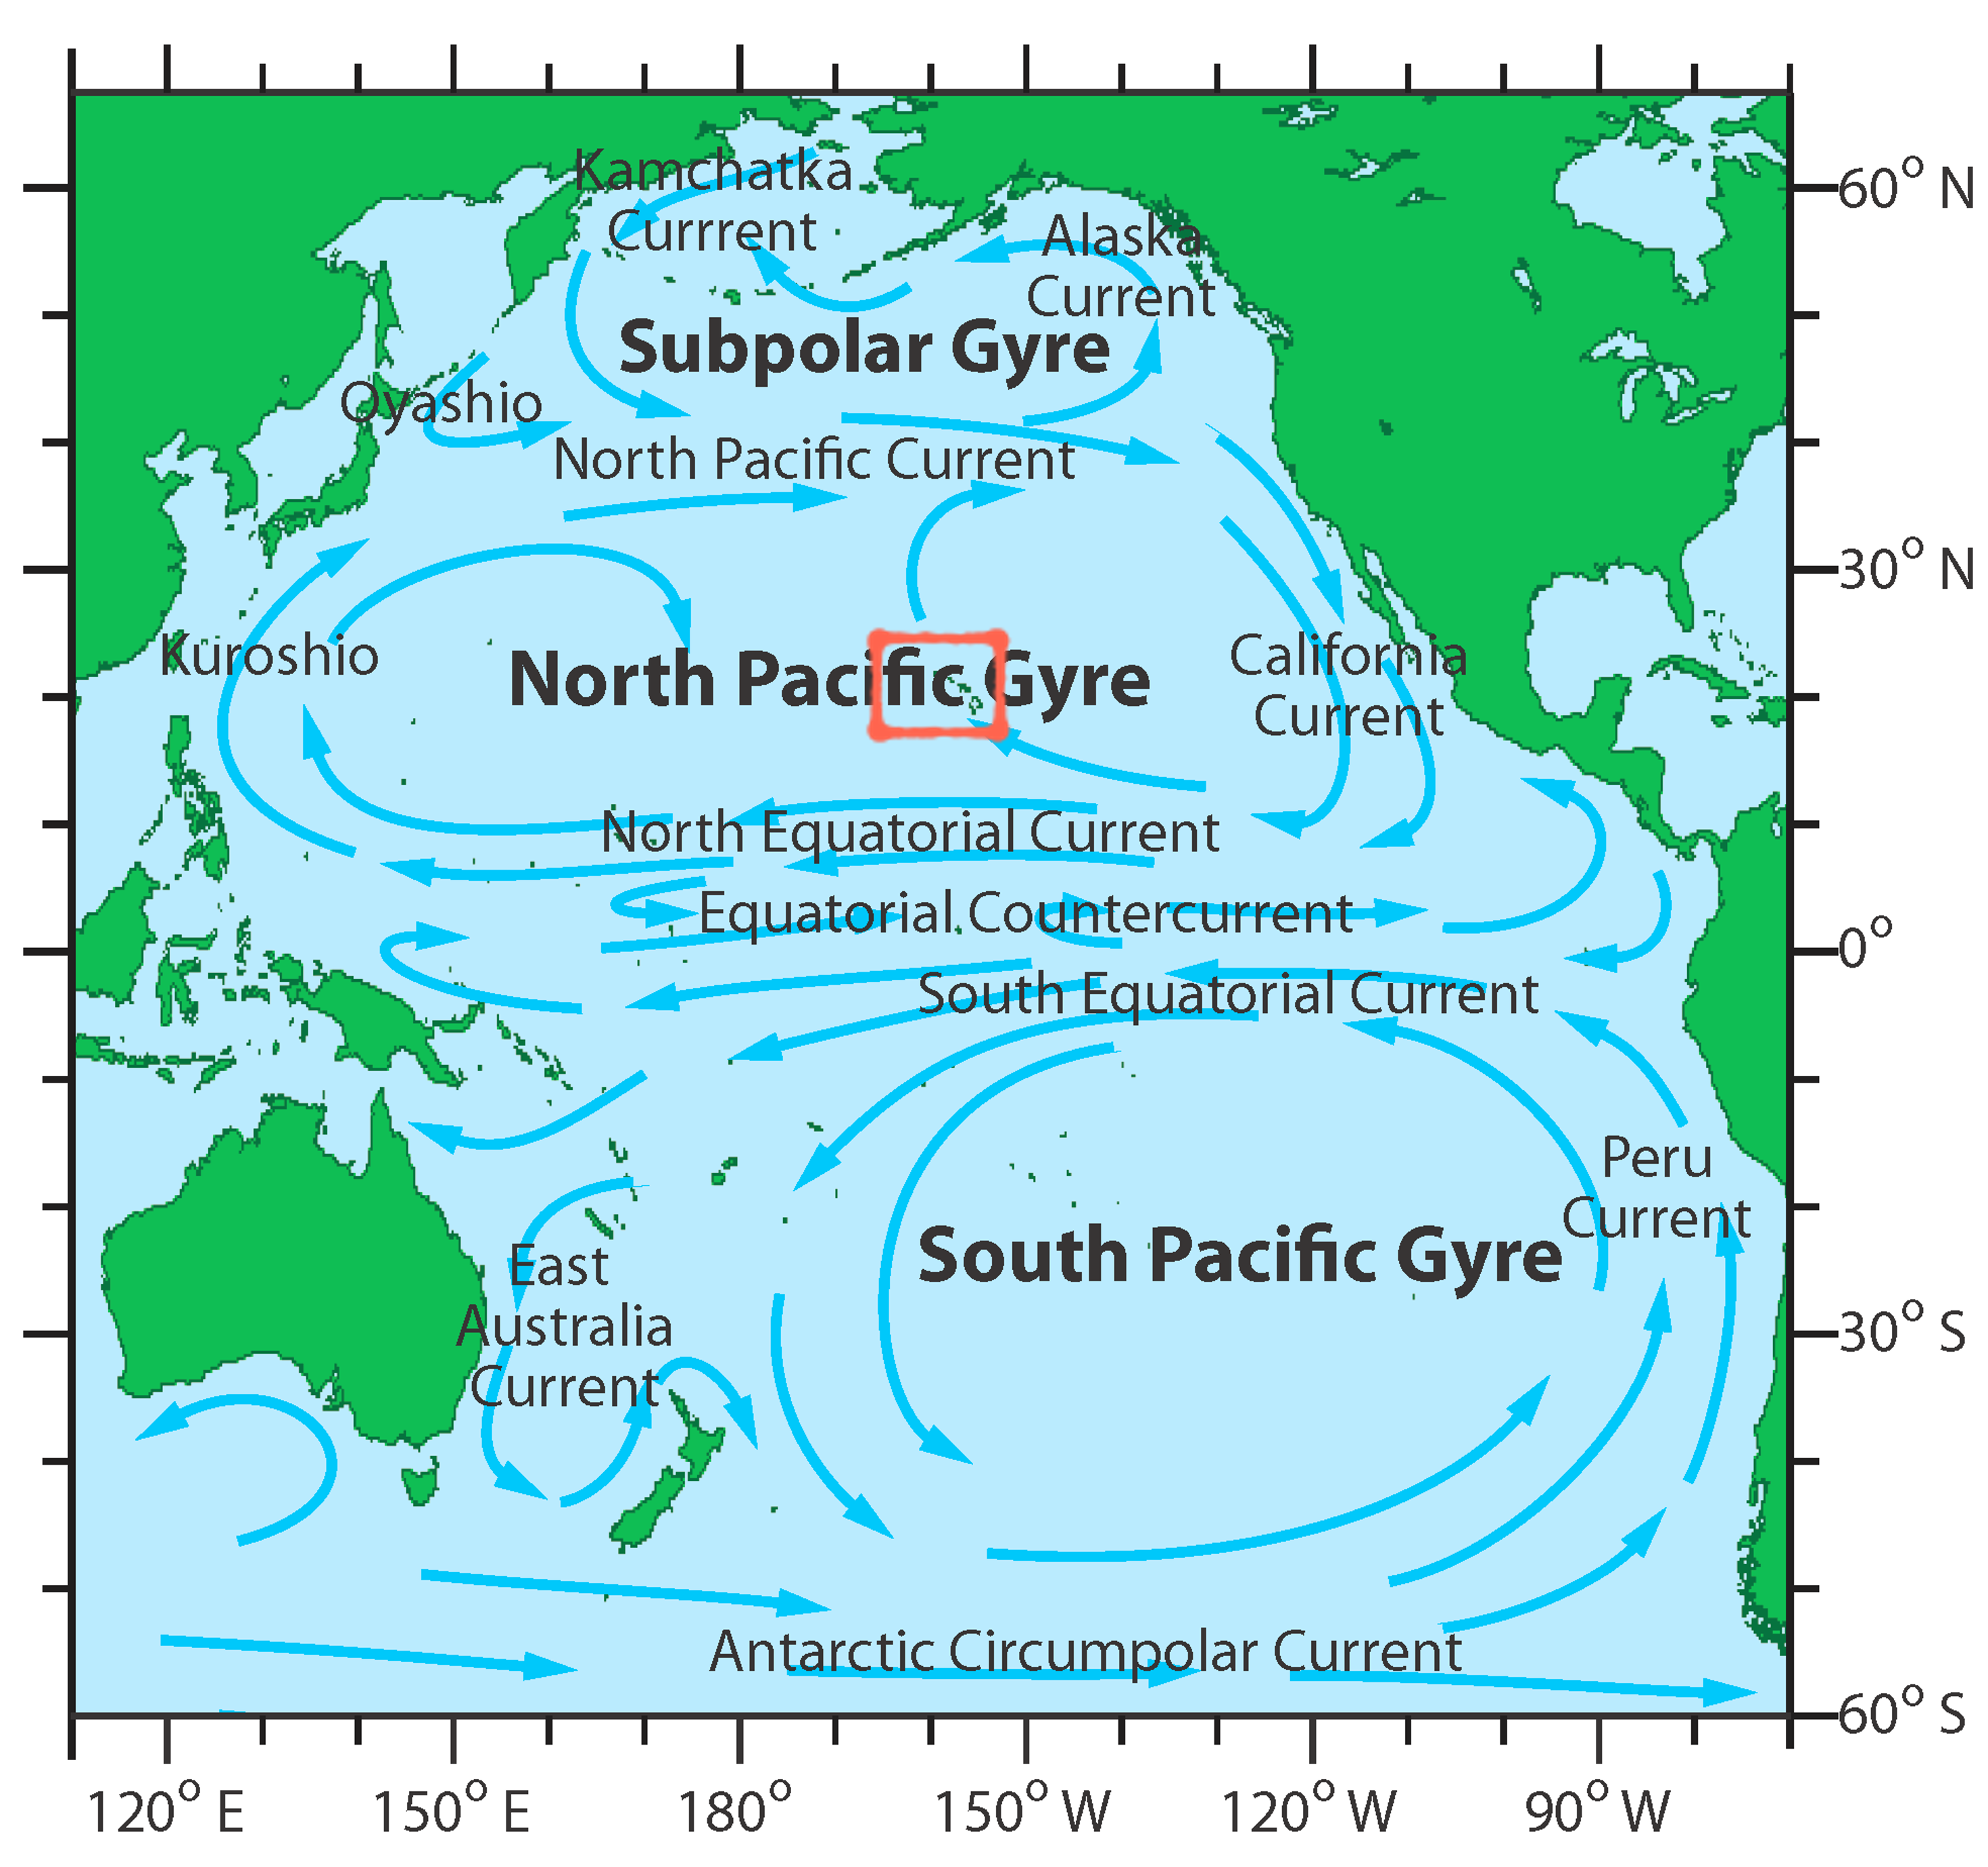
Ocean Acidification (OA) impacts in Hawai‘i are shaped by the islands’ unique physical and oceanographic context. The Main Hawaiian Islands (MHI) are located within the North Pacific Subtropical Gyre, a major ocean current system that shapes local water temperature, chemistry, and other characteristics.
Source: Oceans of Data Institute – Ocean Tracks
Source: Hošeková et al. (2025),
Journal of Geophysical Research: Oceans
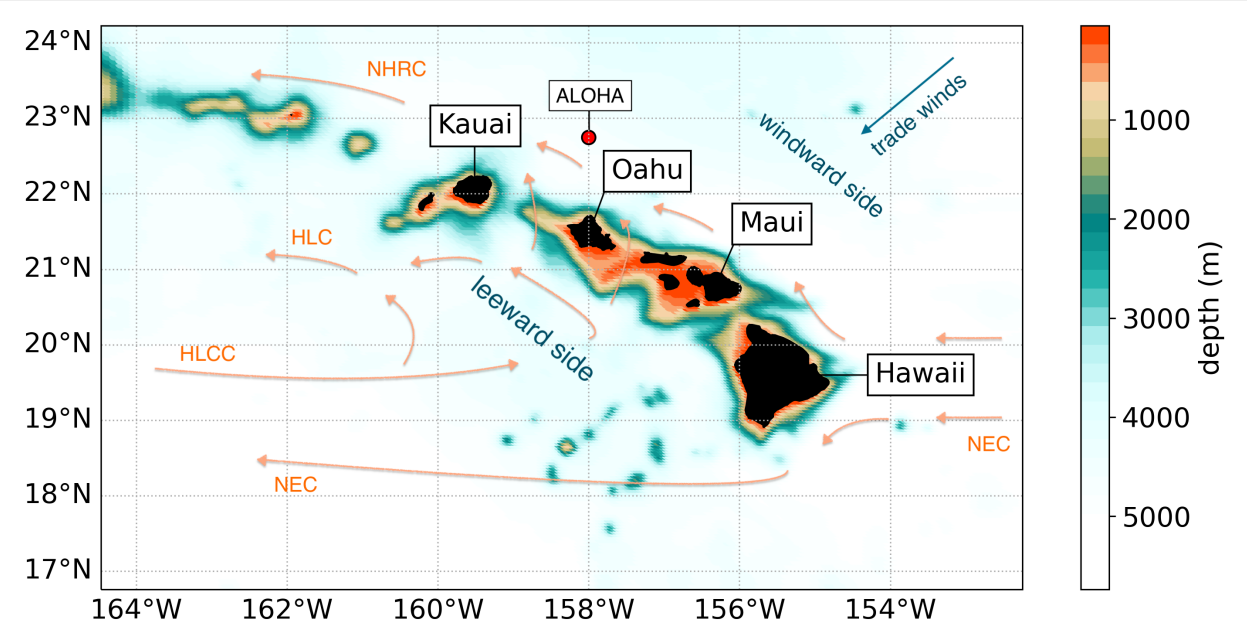
The region's steep bathymetry, with volcanic mountains rising from an abyssal plain over 6,000 meters deep to heights up to 4,000 meters above sea level, interacts with persistent northeasterly trade winds. This interaction disrupts currents, generating eddies and localized upwelling that drive biogeochemical dynamics.
Source: Allen Coral Atlas
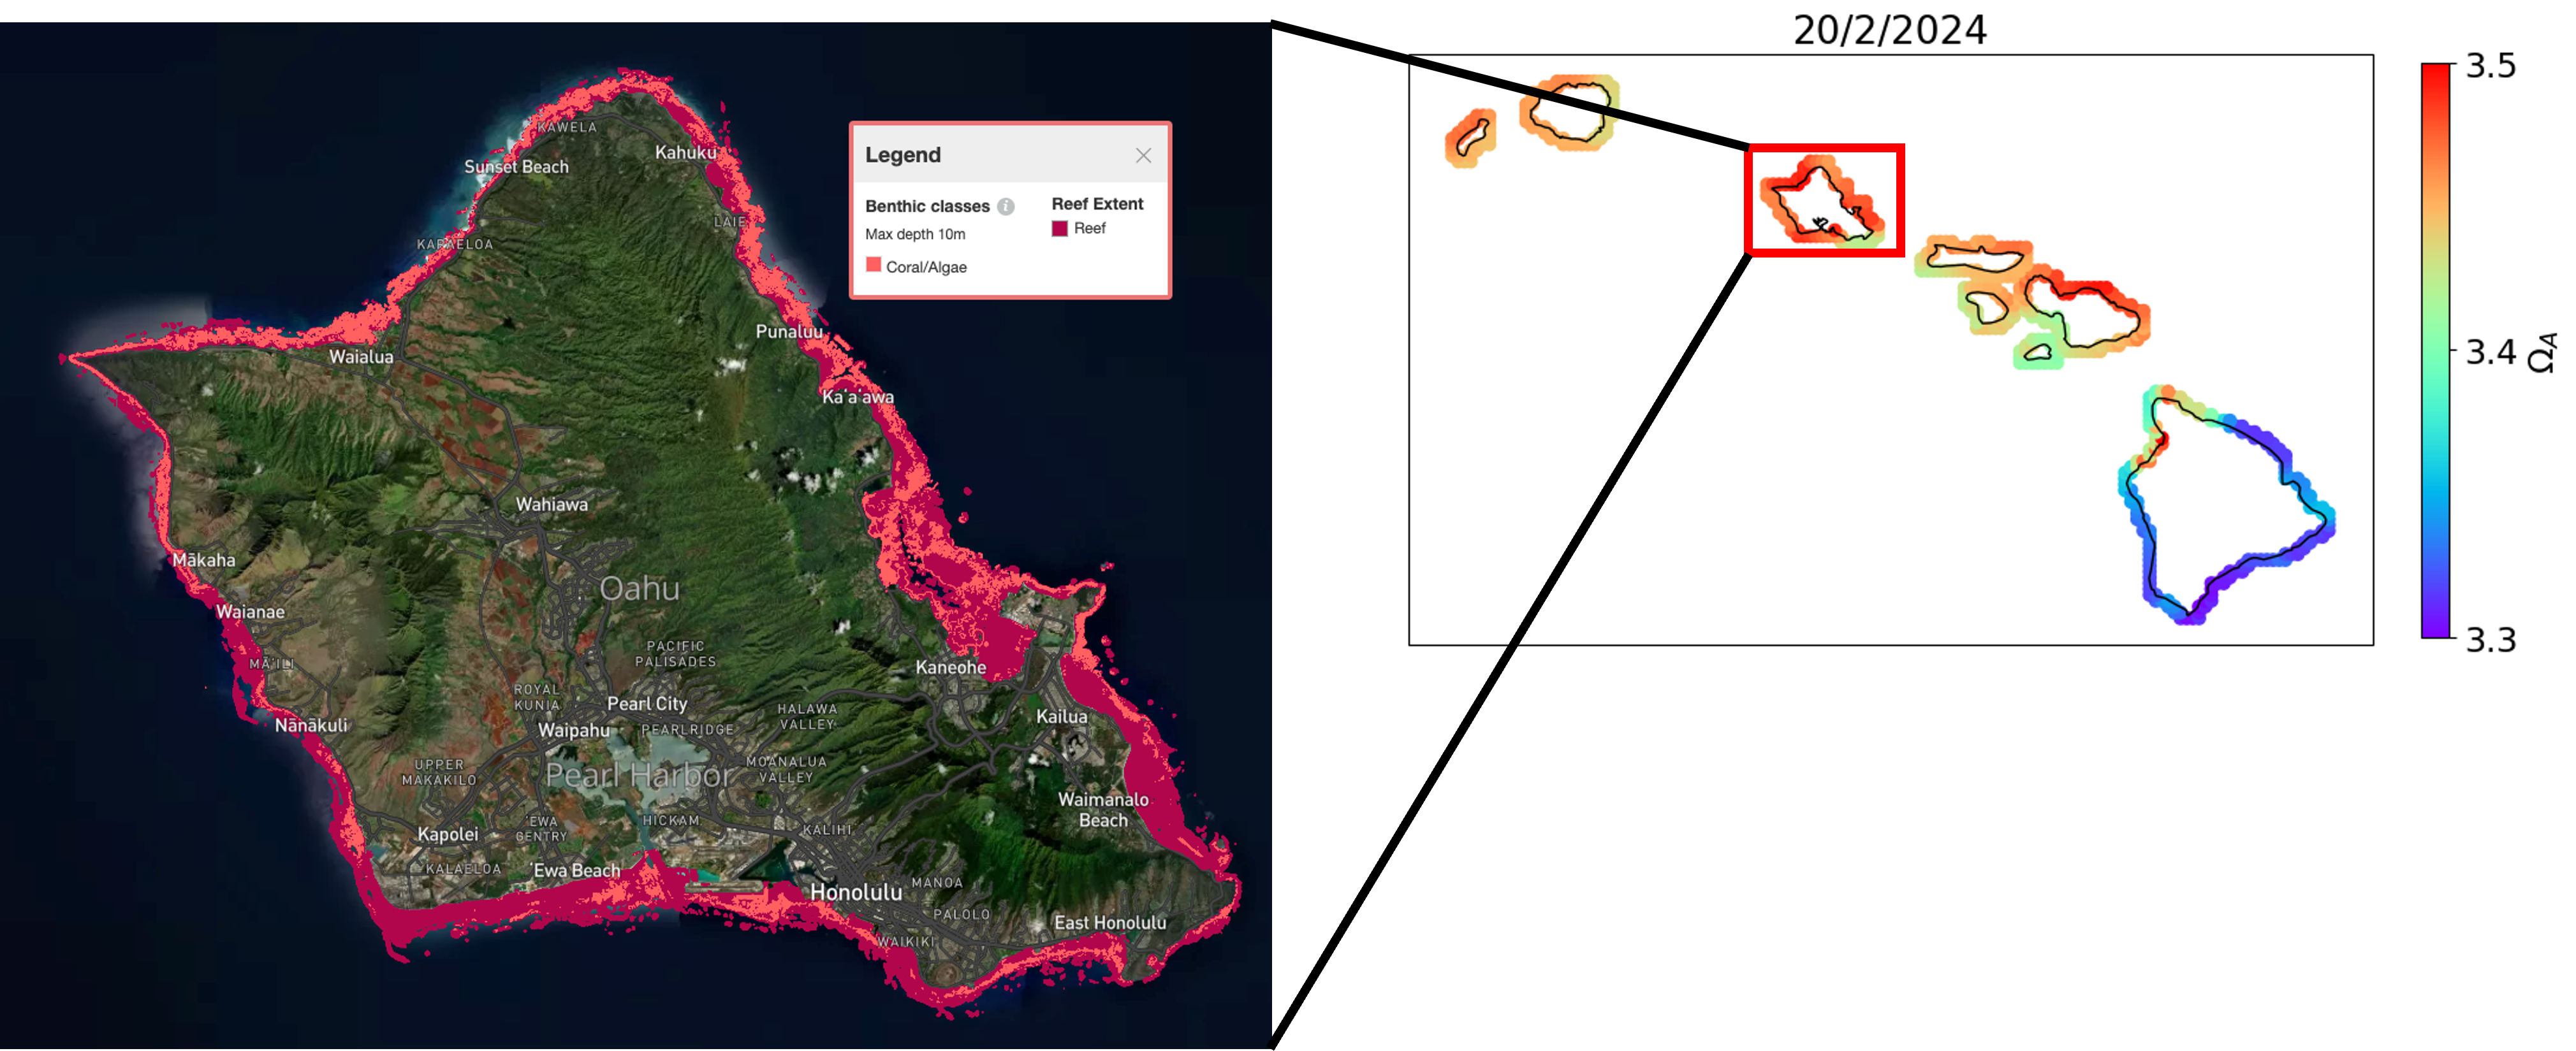
These dynamic oceanographic conditions influence how OA impacts coral reefs, which mostly fringe the shallow (less than 5 km from shore) coastlines of the MHI, complicating predictions of reef vulnerability and resilience. Accurately characterizing these local conditions is essential for understanding and protecting Hawai'i's reefs as ocean chemistry and temperature shift with climate change.
Global Climate Models (GCMs), like the Community Earth System Model Version 2 (CESM2), lack the fine spatial resolution needed for robust local assessments in the MHI. We addressed this limitation by producing the first dynamically downscaled projections of OA for the region spanning 2000-2100 using a coupled Regional Ocean Modeling System (ROMS) and Carbon, Ocean Biogeochemistry and Lower Trophics (COBALT) model nested within CESM2 outputs.
Three Shared Socioeconomic Pathways (SSPs) representing different emission pathways were analyzed:
- SSP1-2.6: Strongly declining emissions (CO₂ peaks at 474 ppm in 2063, declining to 445 ppm by 2100)
- SSP2-4.5: Slowly declining emissions (CO₂ reaching 603 ppm by 2100)
- SSP3-7.0: Increasing emissions, baseline outcome of current trends (CO₂ reaching 871 ppm by 2100)
These SSPs represent plausible futures based on different assumptions about global climate policy, economic development, and population growth.
Source: Hošeková et al. (2025),
Journal of Geophysical Research: Oceans
Our projections track three key indices that measure OA's impact on coral calcification: aragonite saturation state (Ωₐ), pH, and substrate-to-inhibitor ratio (SIR, [HCO₃⁻]/[H⁺]). Under SSP3-7.0, all OA indices decline rapidly and continuously throughout the century. SSP2-4.5 exhibits intermediate trends, with values stabilizing mid-century. Under SSP1-2.6, the decline is slower and may stabilize or slightly reverse after 2060. These projected decreases in Ωₐ, pH and SIR indicate increasing OA and suggest that coral reefs may face greater difficulty maintaining calcification rates, with the extent and timing of these shifts determined by future emissions trajectories.
We also introduced a climate novelty metric to determine when future ocean conditions might move outside the range that coral reefs have experienced in recent history, providing a framework for contextualizing ecological risk. This metric quantifies how much projected values of OA indices, Ωₐ, pH, and SIR, depart from the natural variability observed during a reference period (2005–2020), expressed as the ratio of the anomaly to historical variability. For example, a novelty value of 2 indicates that the anomaly is twice the reference variability, suggesting conditions substantially different from recent historical experience. This approach allows us to identify when and where coral reefs may encounter unprecedented chemical conditions that could exceed their adaptive capacity.
Source: Hošeková et al. (2025),
Journal of Geophysical Research: Oceans
Results show that, under all scenarios, Ωₐ will eventually surpass historical variability ranges, with the magnitude and timing of change strongly dependent on future CO₂ emissions. Under SSP3-7.0, mean Ωₐ novelty reaches approximately 12 times the reference variability by 2100, while SIR novelty reaches 9 times reference levels. In contrast, SSP1-2.6 shows much lower impacts, with Ωₐ novelty peaking at 3 times reference variability mid-century before declining to around 1 by century's end. For SIR, novelty values remain low in SSP1-2.6, peaking at about 3 before gradually returning near present-day levels, while SSP2-4.5 plateaus at intermediate values of around 6 for Ωₐ and 4 for SIR by 2100. These results indicate that, even under the lowest emission scenario, some departure from historical conditions is unavoidable, but the extent of change and potential risk to coral reef adaptation are much greater under higher emissions. The shaded regions in the figure reflect the range across nearshore locations, highlighting spatial variability in projected outcomes.
The spatial distribution of novelty was also analyzed, revealing that both the timing and intensity of exposure to novel conditions vary by location, with windward (northeast-facing) coastlines generally showing higher novelty values. The spatial patterns differ between OA indices: for Ωₐ, novelty tends to increase from south to north, while for SIR, the highest values are found along eastern coastlines. Leeward (southwest) areas, which experience higher baseline variability, generally show lower novelty. These patterns highlight pronounced differences in potential ecological risk across the islands and emphasize the importance of local conditions in shaping future OA impacts.
Source: Hošeková et al. (2025),
Journal of Geophysical Research: Oceans
By the end of the century, nearly all reef areas are projected to experience ocean conditions outside the range observed in recent history. The high-resolution, scenario-based projections from this analysis characterize the local chemical and physical environments that shape coral reef exposure, providing the environmental inputs necessary for evaluating ecosystem responses under changing conditions.
Resources
Hošeková, L., Friedrich, T., Powell, B. S., & Sabine, C. (2025). Patterns of ocean acidification emergence in the Hawaiian Islands using dynamically downscaled projections. Journal of Geophysical Research: Oceans, 130, e2024JC021903. https://doi.org/10.1029/2024JC021903

Scientific Paper
Scan or view online

Code Repository
Scan or view on Dataverse